
INSIGHTS
Step-by-Step Telecom Monopole Tower Inspection Guide
Strategic Pre-Flight Protocols and Sensor Optimization
Modern telecom monopole inspections demand a fundamental shift in methodology, moving beyond rudimentary visual checks to a data-centric approach rooted in high-fidelity photogrammetry. The objective is not merely to capture images, but to acquire precise, measurable data that forms the foundation of a structural digital twin. This process requires meticulous pre-flight planning, sensor optimization, and a deep understanding of regulatory frameworks to ensure both safety and data integrity.
Key Takeaway: Professional monopole inspections necessitate a transition from simple visual checks to a data-science operation built on high-fidelity photogrammetry and multi-sensor payloads.
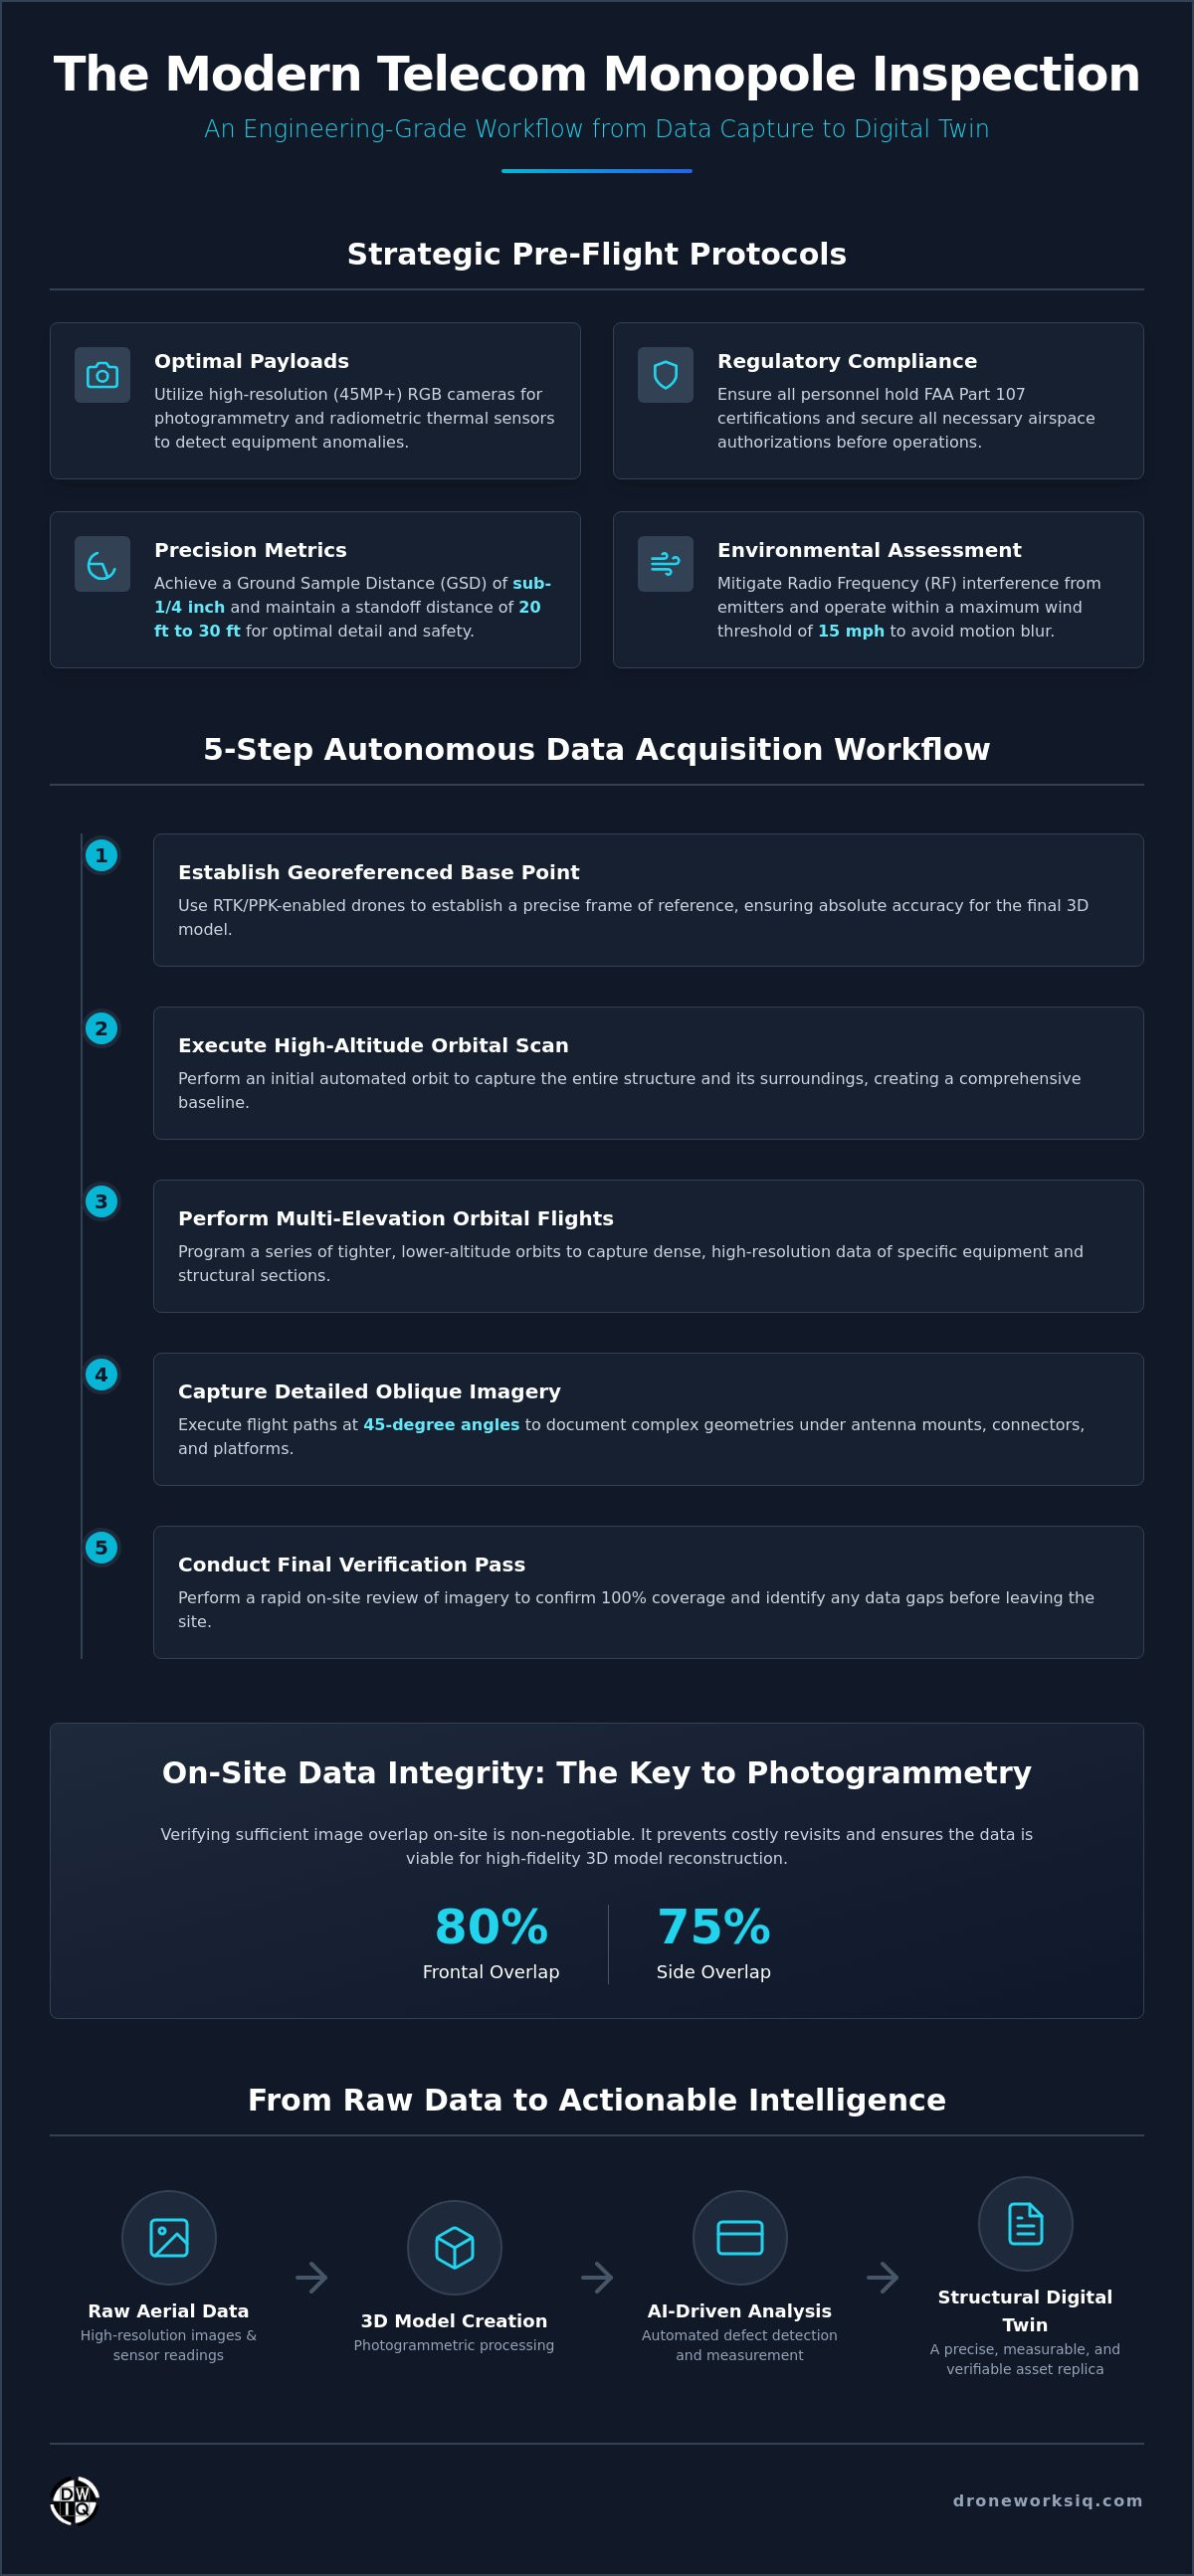
Infographic: A visual flowchart illustrating the transition from raw aerial data to an AI-verified structural report.
Selection of optimal payloads: The primary sensor for this workflow is a high-resolution RGB camera (45MP or greater) capable of capturing the detail required for precise photogrammetric reconstruction and visual defect identification. This is often fused with radiometric thermal sensors to detect otherwise invisible equipment anomalies.
Regulatory compliance: All operations must adhere to stringent federal and local regulations. This includes verifying FAA Part 107 certifications for all flight personnel and securing any necessary airspace authorizations, particularly when operating near critical national infrastructure sites.
Defining Mission Requirements and GSD
The success of a photogrammetry-based inspection is contingent on the quality of the source data. Before any flight, mission parameters must be clearly defined to meet engineering-grade standards. This begins with calculating the required Ground Sample Distance (GSD)—the physical size of a single pixel on the ground. To identify hairline cracks, rust penetration, or loose hardware, a GSD that provides sub-1/4 inch resolution is essential. This level of detail dictates the flight path and standoff distance from the asset.
Calculating Ground Sample Distance (GSD) to ensure sub-1/4 in resolution for identifying hairline cracks and corrosion.
Establishing a 20 ft to 30 ft standoff distance to balance operational safety with the high sensor resolution needed for accurate 3D modeling.
Environmental and RF Interference Assessment
Telecom monopoles exist in complex environments, both physically and electromagnetically. A thorough pre-flight assessment is critical to mitigate risks. The high-power radio frequency (RF) emitters on the tower can interfere with the drone’s command-and-control link and GPS reception. Analyzing the electromagnetic environment and planning flight paths to minimize signal disruption is a key step for operational safety. Equally important are the weather conditions, which directly impact data quality.
Analyzing the electromagnetic environment to mitigate signal loss near high-power telecom emitters.
Weather minimums: Establishing a maximum wind threshold of 15 mph for stable flight and to eliminate motion blur during image acquisition, which is critical for sharp photogrammetric reconstruction.
Systematic Autonomous Flight Execution for Monopole Assets
Executing the inspection requires a systematic, multi-phase flight strategy powered by autonomous mission planning software. Manual flight is inadequate for capturing the consistent, overlapping imagery required for creating a high-fidelity 3D model. Automation ensures that the drone maintains a precise standoff distance and image overlap, adapting its flight path to the monopole’s tapering geometry from base to top. This methodical approach guarantees 100% coverage of all structural components, antenna arrays, cable trays, and mounting hardware.
Implementation of a multi-phase flight strategy to ensure 360-degree coverage of all antenna arrays and structural bolts.
Autonomous path planning to maintain consistent standoff distances and image overlap despite the tapering diameter of the monopole.
Critical focus on verticality: Utilizing high-precision photogrammetric data to create a 3D model capable of detecting leans or structural shifting with sub-inch accuracy.
Incorporating oblique imaging at 45-degree angles to capture the underside of equipment mounts and cable trays—areas often missed by simple orbital flights.
The 5-Step Data Acquisition Workflow
A standardized data acquisition workflow is essential for repeatable, engineering-grade results across a portfolio of assets. This five-step process ensures that every inspection yields a complete and accurate dataset ready for analysis.
Step 1: Establishing a georeferenced base point: Using RTK/PPK-enabled drones and ground control points, establish a georeferenced frame of reference. This provides absolute accuracy for the resulting 3D model, making it a true infrastructure digital twin.
Step 2: Executing a high-altitude orbital scan: Perform an initial automated orbit at a higher altitude to capture the entire structure and its immediate surroundings, establishing a comprehensive baseline for the 3D model.
Step 3: Performing automated orbital flights at multiple elevations: Program a series of tighter, lower-altitude orbital flights. These "tiers" focus on specific sections of the monopole, capturing dense, high-resolution data of equipment, mounts, and structural surfaces.
Step 4: Capturing detailed oblique imagery: Execute automated flight paths that position the camera at oblique angles (typically 45 degrees) to meticulously document the complex geometry of antenna mounts, connectors, and the underside of platforms.
Step 5: Conducting a final verification pass: Before leaving the site, perform a quick review of the captured imagery to confirm complete coverage and identify any gaps that require a final, targeted data capture flight.
Ensuring Data Integrity On-Site
The opportunity to correct data capture errors is lost once the team demobilizes from the site. Therefore, on-site data verification is a non-negotiable step in the professional workflow. This involves a real-time or near-real-time check of the imagery to ensure it meets the stringent requirements for photogrammetric processing. This quality control step prevents costly and time-consuming revisits.
Real-time data quality verification: Checking for motion blur, poor focus, or sensor dropouts before demobilizing.
Verifying 80% frontal and 75% side overlap to support high-fidelity photogrammetric reconstruction and eliminate data gaps in the final 3D model.
Advanced Data Synthesis and AI-Driven Structural Analysis
Once the raw data is collected, the next phase transforms it from simple images into actionable infrastructure intelligence. This is accomplished through a combination of photogrammetry and AI-driven geospatial analytics. The thousands of high-resolution photographs are processed to create a dense, survey-grade 3D point cloud and a textured mesh model of the monopole. This digital replica becomes the canvas for advanced analysis.
Transforming raw imagery into a high-density point cloud and 3D model via advanced photogrammetric processing.
Automated defect recognition: Utilizing machine learning models to programmatically scan the model and source imagery to identify and classify defects such as rust, corrosion, missing bolts, and cable fraying.
Photogrammetric 3D Model Analysis: Measuring the "lean" and "twist" of the monopole with precision down to 1/2 in by analyzing the georeferenced 3D model against its as-built specifications.
Thermal anomaly detection: Identifying overheating components on the antenna array or power systems by analyzing fused radiometric thermal data, which can indicate impending equipment failure.
Generating the Infrastructure Intelligence Report
The ultimate deliverable is not a folder of images or a 3D model, but an actionable intelligence report that empowers asset managers to make informed maintenance decisions. This report synthesizes all findings into a clear, concise format. Defects are annotated directly onto the 3D model, providing precise location data, and are accompanied by high-resolution "call-out" images for detailed engineering review. Each finding is categorized by severity (e.g., Critical, Major, Minor) to help prioritize maintenance schedules and allocate budgets effectively.
Categorizing defects by severity (Critical, Major, Minor) to prioritize maintenance budgets.
Annotating 3D models with high-resolution "call-out" images for engineering review.
Digital Twin Synchronization
The inspection process culminates in the synchronization of the newly acquired data with the asset's existing digital twin. This act of updating the model transforms the inspection from a static, one-time event into a living record of the asset's lifecycle. Digital twins allow for temporal analysis of structural degradation over multiple years, enabling predictive insights into asset health.
Integrating the new inspection data into the existing asset lifecycle model.
Digital twins allow for temporal analysis of structural degradation over multiple years by overlaying datasets from multiple inspections to track changes over time.
Strategic Integration of Digital Twins into Asset Management
Adopting a digital twin-centric inspection program provides strategic advantages that extend far beyond a single tower. By leveraging enterprise drone mapping services, telecom operators can scale this high-precision methodology across an entire national portfolio of assets, creating a unified and standardized database of infrastructure health. This programmatic approach unlocks significant operational efficiencies and enhances long-term strategic planning.
Leveraging enterprise-scale drone operations to standardize inspections across a national portfolio.
Reducing O&M costs by up to 30% through the elimination of unnecessary manual climbs and reactive "truck rolls."
Enhancing insurance compliance and audit readiness with immutable, georeferenced digital records of asset condition.
Utilizing the digital twin for remote pre-installation planning of new 5G equipment, verifying available space and mount integrity without a site visit.
The ROI of Autonomous Oversight
The return on investment for an autonomous inspection program is multifaceted. The most immediate benefit is the dramatic improvement in safety by removing human climbers from high-risk environments. This directly translates to lower insurance premiums and a reduction in potential liability. Furthermore, the rapid data turnaround—from data capture to actionable report in days rather than weeks—enables maintenance teams to shift from a costly reactive cycle to a more efficient, proactive maintenance posture. Utilizing advanced communication platforms like Nexdial to automate outreach and coordinate these repairs further enhances this efficiency, allowing teams to address minor issues before they escalate into major failures.
Comparing the superior safety profile of UAV inspections vs. traditional rope access methodologies.
How rapid data turnaround enables proactive rather than reactive maintenance cycles, extending asset lifespan.
Future-Proofing Telecom Infrastructure
The highly detailed 3D models generated through this process are not just for today's maintenance needs; they are essential tools for future-proofing the network. As carriers prepare for aggressive 5G and future 6G rollouts, having a precise 3D inventory of every tower's available space and structural load capacity is a significant competitive advantage. This data allows for faster, more accurate network planning and deployment. The next frontier involves integrating AI-driven predictive modeling, which will analyze temporal data within the digital twin to forecast potential structural failure points before they occur.
Preparing for 5G/6G rollouts by having precise 3D space inventories of every tower.
Integrating AI-driven predictive modeling to forecast structural failure points before they occur.
Frequently Asked Questions
Is drone data accurate enough for telecom structural certification?Yes. When collected using an RTK/PPK-enabled drone and processed with proper photogrammetric techniques, the resulting 3D models can achieve survey-grade accuracy (sub-inch). This level of precision is sufficient for detailed structural analysis, including verticality and component measurements required for engineering certification.
How long does a typical drone monopole inspection take to complete?On-site data acquisition for a standard monopole (under 200 ft) can typically be completed in 1 to 2 hours by a single certified pilot. This is a significant reduction from the half-day or full-day requirement for a traditional climbing crew.
What is the maximum wind speed for a safe photogrammetric data capture?For optimal photogrammetric data quality, a maximum sustained wind speed of 15 mph is recommended. While enterprise-grade drones can handle stronger winds, exceeding this threshold increases the risk of motion blur in images, which can compromise the quality and accuracy of the final 3D model.
Can drones detect RF interference or signal degradation?While the inspection drone itself does not measure RF signals, specialized payloads can be used for this purpose. However, the primary inspection focuses on the physical integrity of the structure and its components. The visual and thermal data can identify physical damage to antennas or cables that could be the root cause of signal degradation.
How does photogrammetric verticality analysis compare to traditional methods?Photogrammetric analysis provides a comprehensive 3D measurement of the entire structure's verticality (lean and twist), whereas traditional plumb-bob methods only measure a single point. The georeferenced 3D model from a drone provides a far richer dataset, allowing engineers to analyze structural deformity along the entire length of the monopole with high precision, often exceeding the practical accuracy of on-site manual measurements.
Originally published by DroneWorksIQ. Legacy source.